Prometheus进程监控–process_exporter Github: https://github.com/ncabatoff/process-exporter
或者下载最新的release(当前是v0.7.5):
1
2
3
4
$ wget https://github.com/ncabatoff/process-exporter/releases/download/v0.7.5/process-exporter-0.7.5.linux-amd64.tar.gz $ tar zvxf process-exporter-0.7.5.linux-amd64.tar.gz $ cp process-exporter-0.7.5.linux-amd64/process-exporter /usr/bin/
1
2
3
4
5
6
7
8
9
10
11
12
13
14
15
16
17
18
19
20
21
process_names: - name: "{{.Matches}} " cmdline: - '/usr/bin/yig' - name: "{{.Matches}} " cmdline: - '/usr/bin/caddy' - name: "{{.Matches}} " cmdline: - '/usr/bin/meepo' - name: "{{.Matches}} " cmdline: - 'kafka.Kafka' - name: "{{.Matches}} " cmdline: - 'org.apache.zookeeper.server.quorum.QuorumPeerMain'
1
2
3
4
5
6
7
8
9
10
11
12
13
14
15
$ vim /usr/lib/systemd/system/process_exporter.service [Unit] Description=Prometheus exporter for processors metrics, written in Go with pluggable metric collectors. Documentation=https://github.com/ncabatoff/process-exporter After=network.target [Service] Type=simple User=yig ExecStart=/usr/bin/process-exporter -config.path=/etc/exporters/process-exporter.yaml Restart=on-failure [Install] WantedBy=multi-user.target
1
2
3
systemctl daemon-reload systemctl start process_exporter systemctl enable process_exporter
1
2
3
4
5
6
- job_name: 'process_exporter' static_configs: - targets: - 10.0 .42 .61 :9256 labels: region: oss-test-1
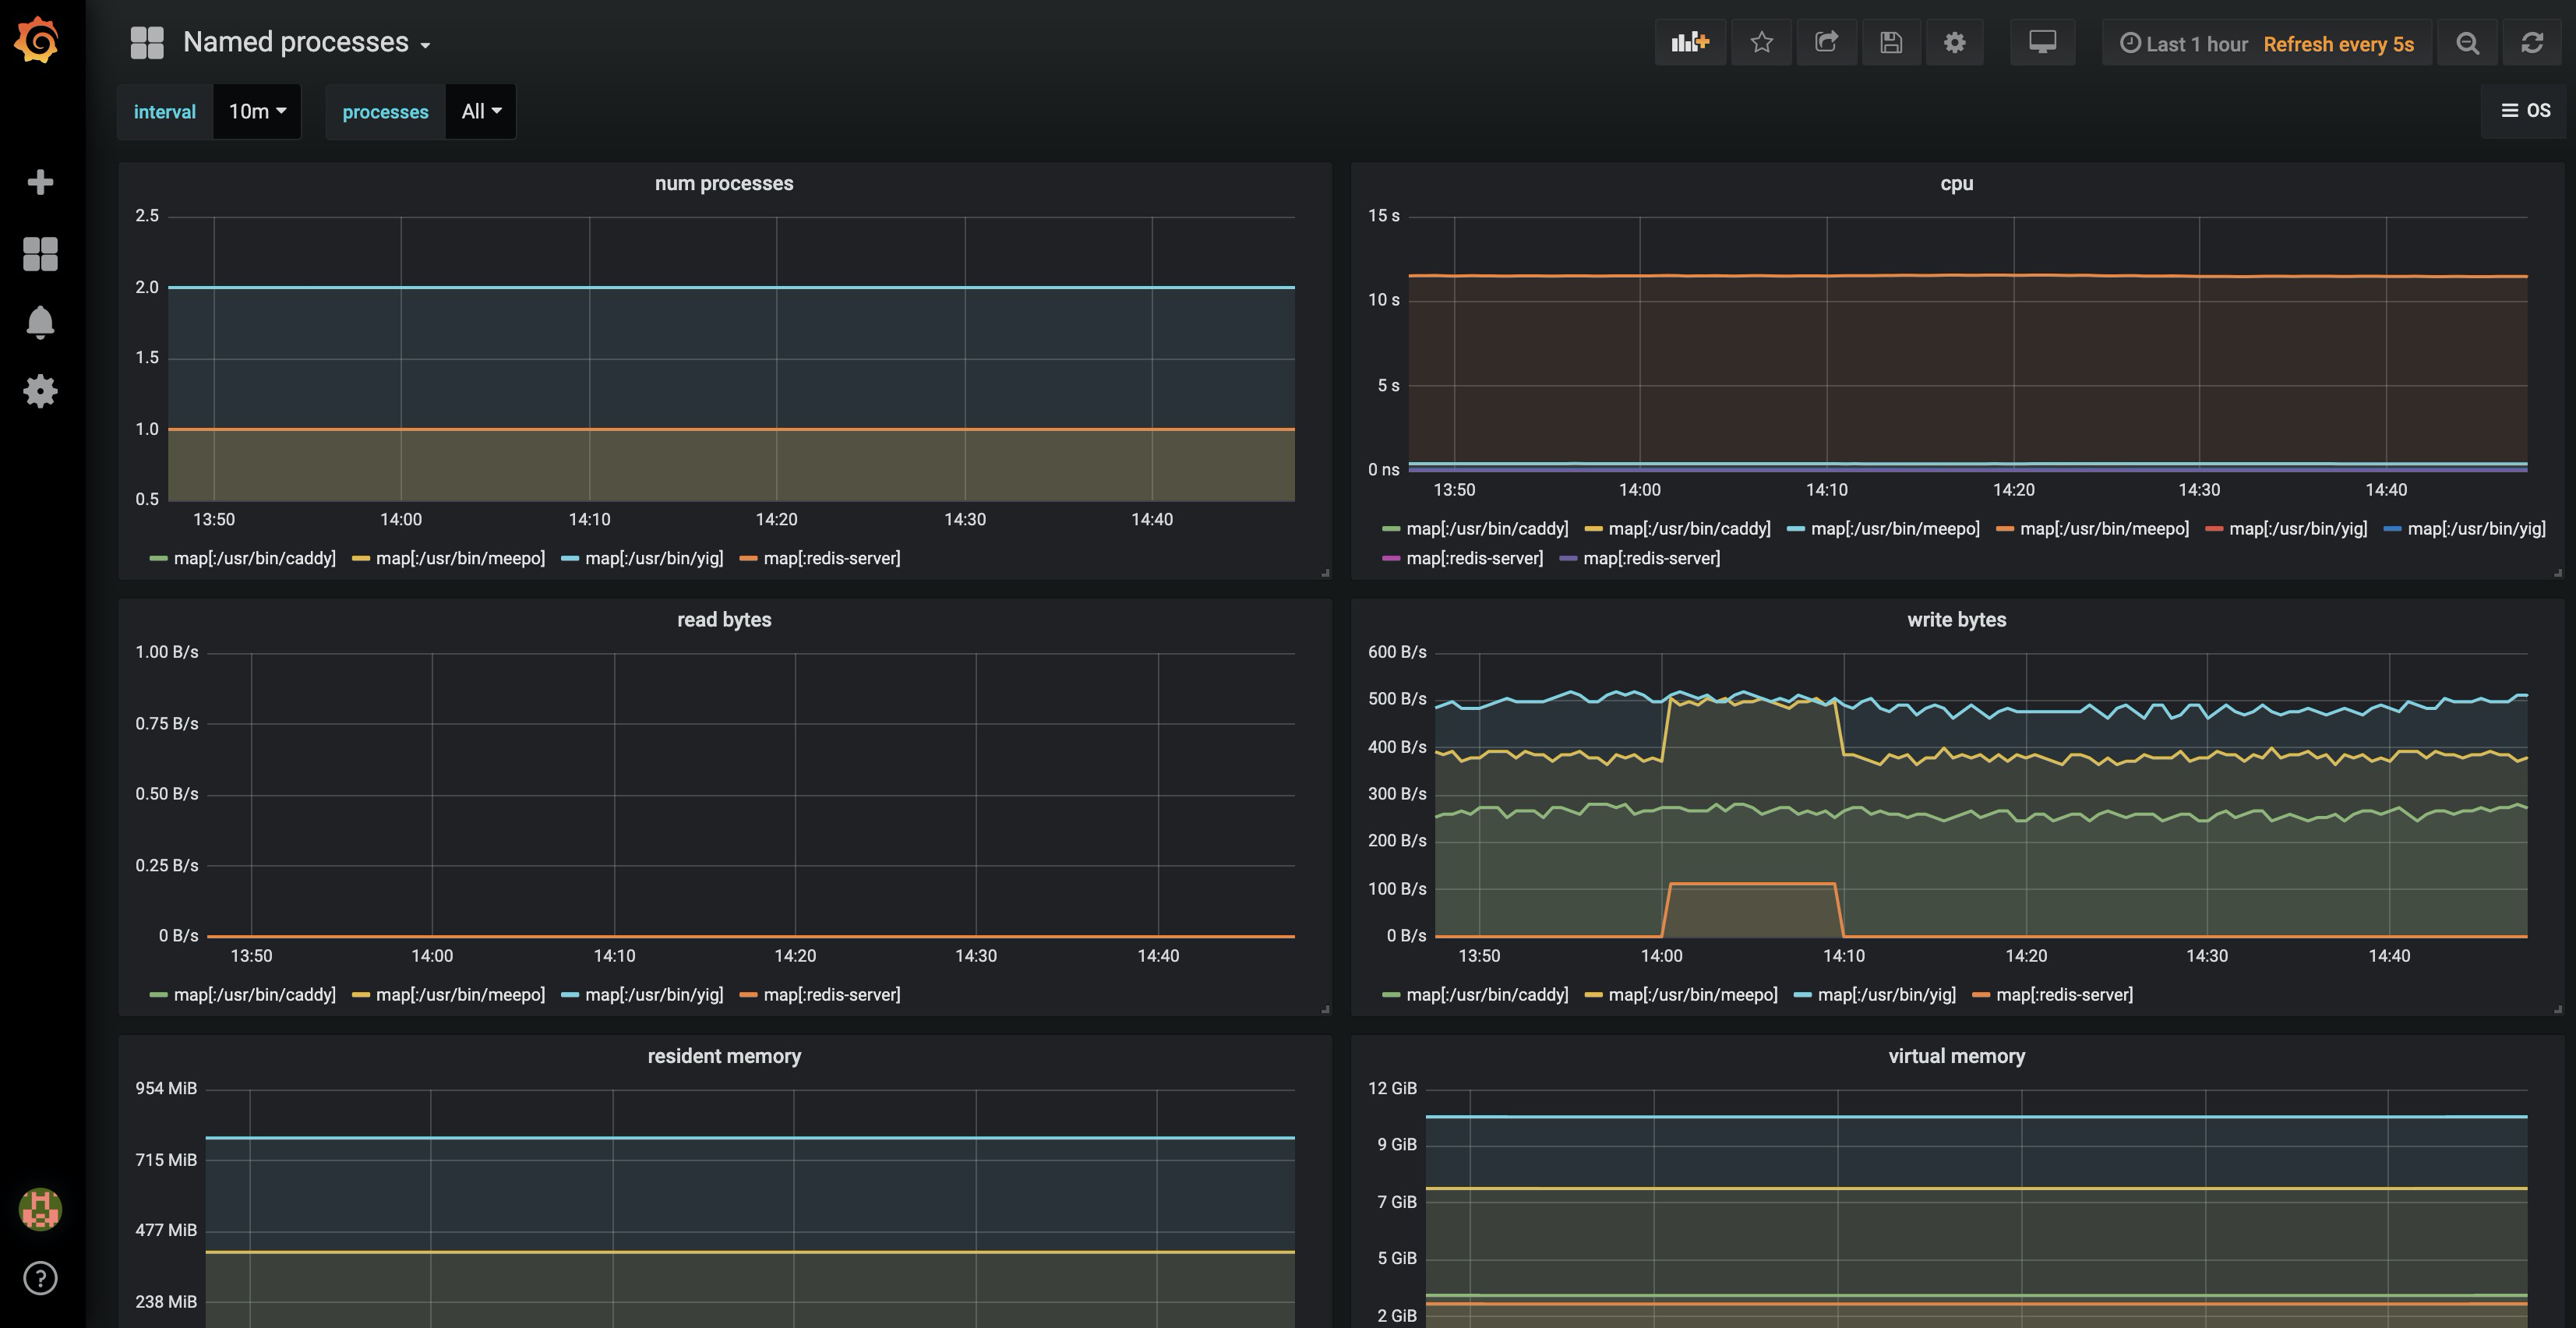
Grafana grafana -> Create -> import
添加id:249
Import后,调整Prometheus数据源即可
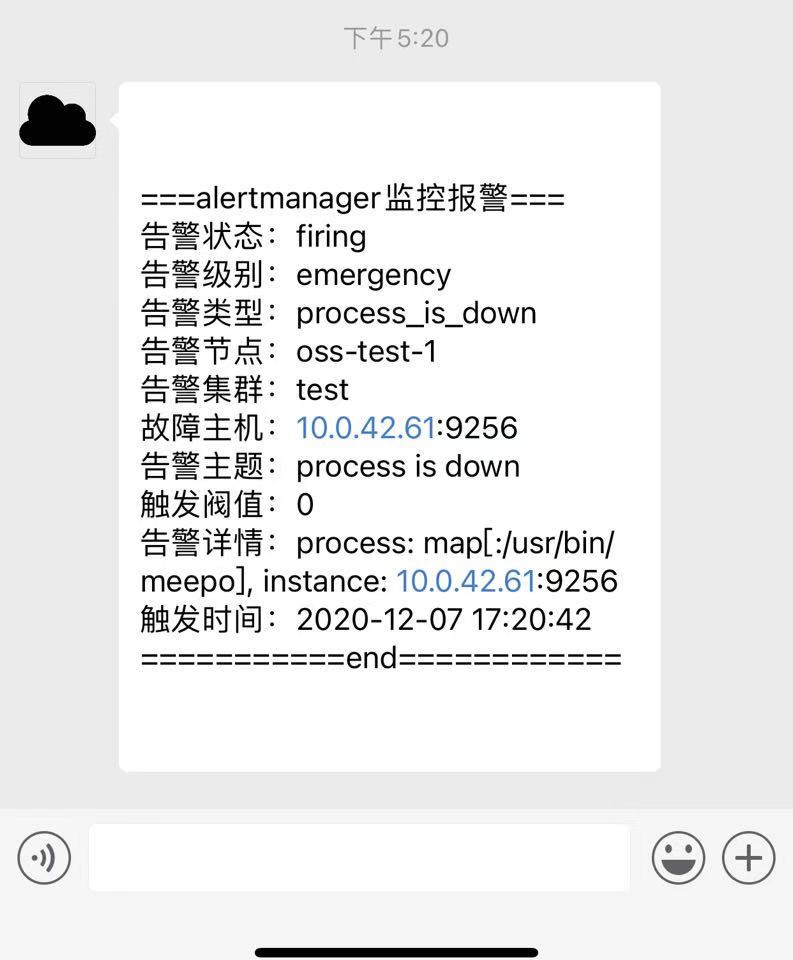
Alert
1
2
3
4
5
6
7
8
9
10
11
12
13
14
15
groups: - name: alert.rules rules: - alert: process_is_down expr: sum (namedprocess_namegroup_states) by (groupname, instance, region) == 0 for: 30s labels: region: '{{ $labels.region }} ' env: 'test' level: emergency expr: sum (namedprocess_namegroup_states) by (groupname, instance, region) == 0 annotations: description: 'process: {{ $labels.groupname }} , instance: {{ $labels.instance }} ' value: '{{ $value }} ' summary: process is down